141 lines
4.7 KiB
Markdown
141 lines
4.7 KiB
Markdown
# SQLAlchemy Easy Profile
|
|
[](https://travis-ci.com/dmvass/sqlalchemy-easy-profile)
|
|
[](https://pypi.python.org/pypi/sqlalchemy-easy-profile)
|
|
[](https://codecov.io/gh/dmvass/sqlalchemy-easy-profile)
|
|
[](https://github.com/dmvass/sqlalchemy-easy-profile/blob/master/LICENSE)
|
|
|
|
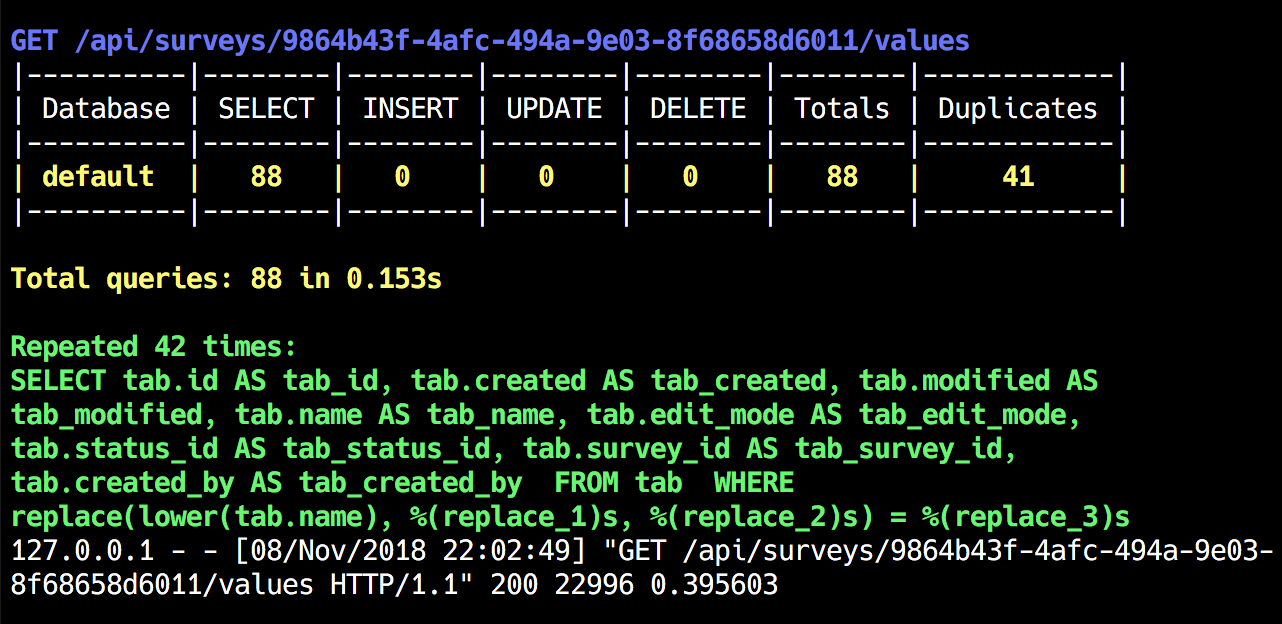
Inspired by [django-querycount](https://github.com/bradmontgomery/django-querycount),
|
|
is a library that hooks into SQLAlchemy to collect metrics, streaming statistics into
|
|
console output and help you understand where in application you have slow or redundant
|
|
queries.
|
|
|
|
|
|
|
|
## Installation
|
|
Install the package with pip:
|
|
```
|
|
pip install sqlalchemy-easy-profile
|
|
```
|
|
|
|
## Session profiler
|
|
The profiling session hooks into SQLAlchemy and captures query statements, duration information,
|
|
and query parameters. You also may have multiple profiling sessions active at the same
|
|
time on the same or different Engines. If multiple profiling sessions are active on the
|
|
same engine, queries on that engine will be collected by both sessions and reported on
|
|
different reporters.
|
|
|
|
You may begin and commit a profiling session as much as you like. Calling begin on an already
|
|
started session or commit on an already committed session will raise an `AssertionError`.
|
|
You also can use a contextmanager interface for session profiling or used it like a decorator.
|
|
This has the effect of only profiling queries occurred within the decorated function or inside
|
|
a manager context.
|
|
|
|
How to use `begin` and `commit`:
|
|
```python
|
|
from easy_profile import SessionProfiler
|
|
|
|
profiler = SessionProfiler()
|
|
|
|
profiler.begin()
|
|
session.query(User).filter(User.name == "Arthur Dent").first()
|
|
profiler.commit()
|
|
|
|
print(profiler.stats)
|
|
```
|
|
|
|
How to use as a context manager interface:
|
|
```python
|
|
profiler = SessionProfiler()
|
|
with profiler:
|
|
session.query(User).filter(User.name == "Arthur Dent").first()
|
|
|
|
print(profiler.stats)
|
|
```
|
|
|
|
How to use profiler as a decorator:
|
|
```python
|
|
profiler = SessionProfiler()
|
|
|
|
class UsersResource:
|
|
@profiler()
|
|
def on_get(self, req, resp, **args, **kwargs):
|
|
return session.query(User).all()
|
|
```
|
|
|
|
Keep in mind that profiler decorator interface accepts a special reporter and
|
|
If it was not defined by default will be used a base streaming reporter. Decorator
|
|
also accept `name` and `name_callback` optional parameters.
|
|
|
|
## WSGI integration
|
|
Easy Profiler provides a specified middleware which can prints the number of database
|
|
queries for each HTTP request and can be applied as a WSGI server middleware. So you
|
|
can easily integrate Easy Profiler into any WSGI application.
|
|
|
|
How to integrate with a Flask application:
|
|
```python
|
|
from flask import Flask
|
|
from easy_profile import EasyProfileMiddleware
|
|
|
|
app = Flask(__name__)
|
|
app.wsgi_app = EasyProfileMiddleware(app.wsgi_app)
|
|
```
|
|
|
|
How to integrate with a Falcon application:
|
|
```python
|
|
import falcon
|
|
from easy_profile import EasyProfileMiddleware
|
|
|
|
api = application = falcon.API()
|
|
application = EasyProfileMiddleware(application)
|
|
```
|
|
|
|
## How to customize output
|
|
|
|
The `StreamReporter` accepts medium-high thresholds, output file destination (stdout by default), a special
|
|
flag for disabling color formatting and number of displayed duplicated queries:
|
|
|
|
```python
|
|
from flask import Flask
|
|
from easy_profile import EasyProfileMiddleware, StreamReporter
|
|
|
|
app = Flask(__name__)
|
|
app.wsgi_app = EasyProfileMiddleware(app.wsgi_app, reporter=StreamReporter(display_duplicates=100))
|
|
```
|
|
|
|
Any custom reporter can be created as:
|
|
|
|
```python
|
|
from easy_profile.reporters import Reporter
|
|
|
|
class CustomReporter(Reporter):
|
|
|
|
def report(self, path, stats):
|
|
"""Do something with path and stats.
|
|
|
|
:param str path: where profiling occurred
|
|
:param dict stats: profiling statistics
|
|
|
|
"""
|
|
...
|
|
|
|
```
|
|
|
|
## Testing
|
|
To run the tests:
|
|
```
|
|
python setup.py test
|
|
```
|
|
|
|
Or use `tox` for running in all tests environments.
|
|
|
|
## License
|
|
This code is distributed under the terms of the MIT license.
|
|
|
|
## Changes
|
|
A full changelog is maintained in the [CHANGELOG](https://github.com/dmvass/sqlalchemy-easy-profile/blob/master/CHANGELOG.md) file.
|
|
|
|
## Contributing
|
|
**sqlalchemy-easy-profile** is an open source project and contributions are
|
|
welcome! Check out the [Issues](https://github.com/dmvass/sqlalchemy-easy-profile/issues)
|
|
page to see if your idea for a contribution has already been mentioned, and feel
|
|
free to raise an issue or submit a pull request.
|